Views
In myReach, Views are different ways to visualise and interact with your data. Depending on whether you are doing high-level research, managing a project or cleaning up your database, different layouts can help you see your information more clearly.
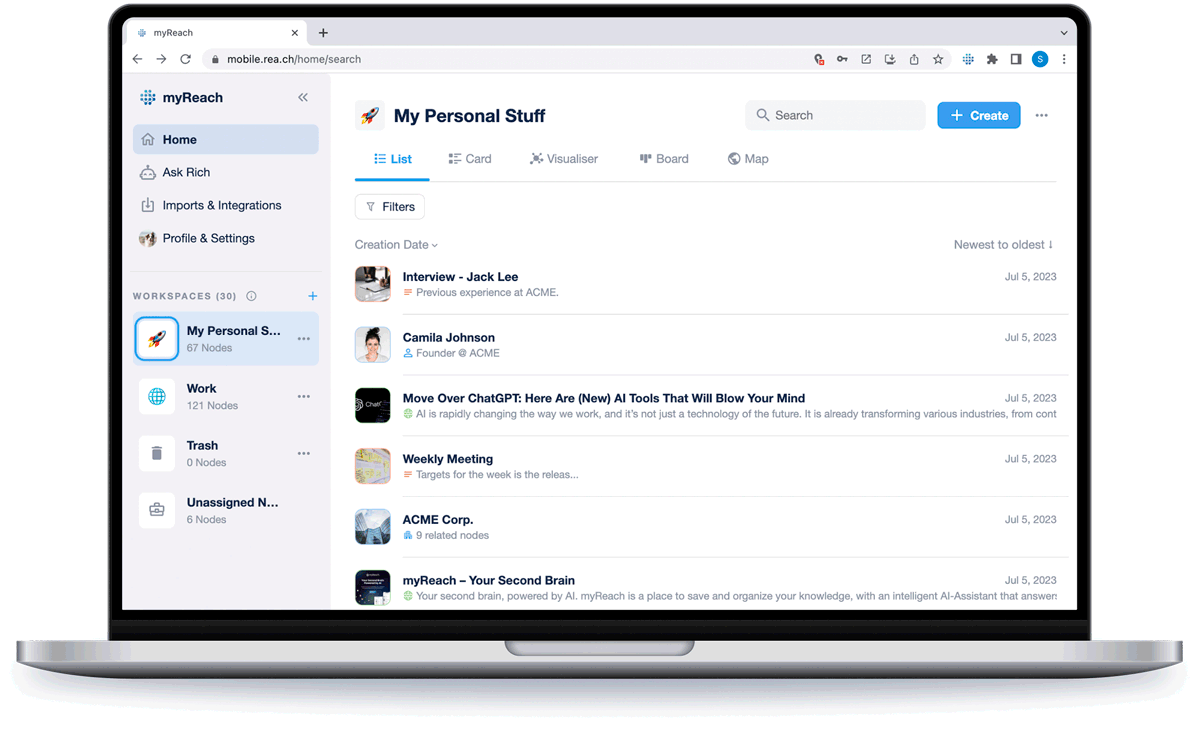
You can switch between these views using the icons located just beneath the Workspace Name in the Knowledge Base (just above the filter pannel).
Views Breakdown
Here's a breakdown of the views available in myReach:
– List View
The high-density choice. This view is best for scanning through large volumes of information quickly. It provides a clean, vertical list where you can see the Node titles a description and key metadata at a glance.
– Card View
The visual choice. Card View displays your Nodes as interactive tiles with large image previews. This is ideal for managing visual assets, website bookmarks or any content where the visual "gist" is more important than the text.
– Table View
The structured choice. Similar to a spreadsheet, Table View allows you to see all your Node Properties in columns. It's the best view for comparing data points like costs, dates or ratings across multiple files.
- 3D Visualiser View
The contextual choice. Our signature view that shows your Knowledge Base as an interconnected 3-dimensional web. It helps you see the "big picture", identify hubs of information and understand how disparate Nodes are linked together through Relationships.
- Board View
The project management choice. Board View organises your Nodes into columns based on a specific Property (like Status or Priority). It?s perfect for moving items through a workflow, such as "To Do", "In Progress" and "Done".
Customising Your View
Regardless of which view you choose, you can always apply Filters and Sorting to further refine what you see.