3D Visualiser
The 3D Visualiser is our signature view. It transforms your Knowledge Base from a collection of isolated files into a dynamic, interconnected 3-dimensional neural network. By visualising your data in 3D, you can see how projects, people, ideas and documents are linked together, helping you identify "hubs" of information and hidden context.
Navigating the Graph
The Graph is composed of an interactive navigation. You can rotate and spin the view to explore your interconnected data fully.
In the Mobile App:
-
Swipe with ONE finger to rotate around the visualiser
-
Swipe with TWO fingers to pan vertically or horizontally
-
Pinch with two fingers to zoom in and out
In the Web App:
-
Click + Swipe with ONE finger to rotate around the visualiser
-
Click + Swipe with TWO fingers to pan vertically or horizontally
-
Swipe up or down with two fingers to zoom in and out
To centre the visualiser, click on the three buttons option and then “Center Visualiser” in the workspace options.
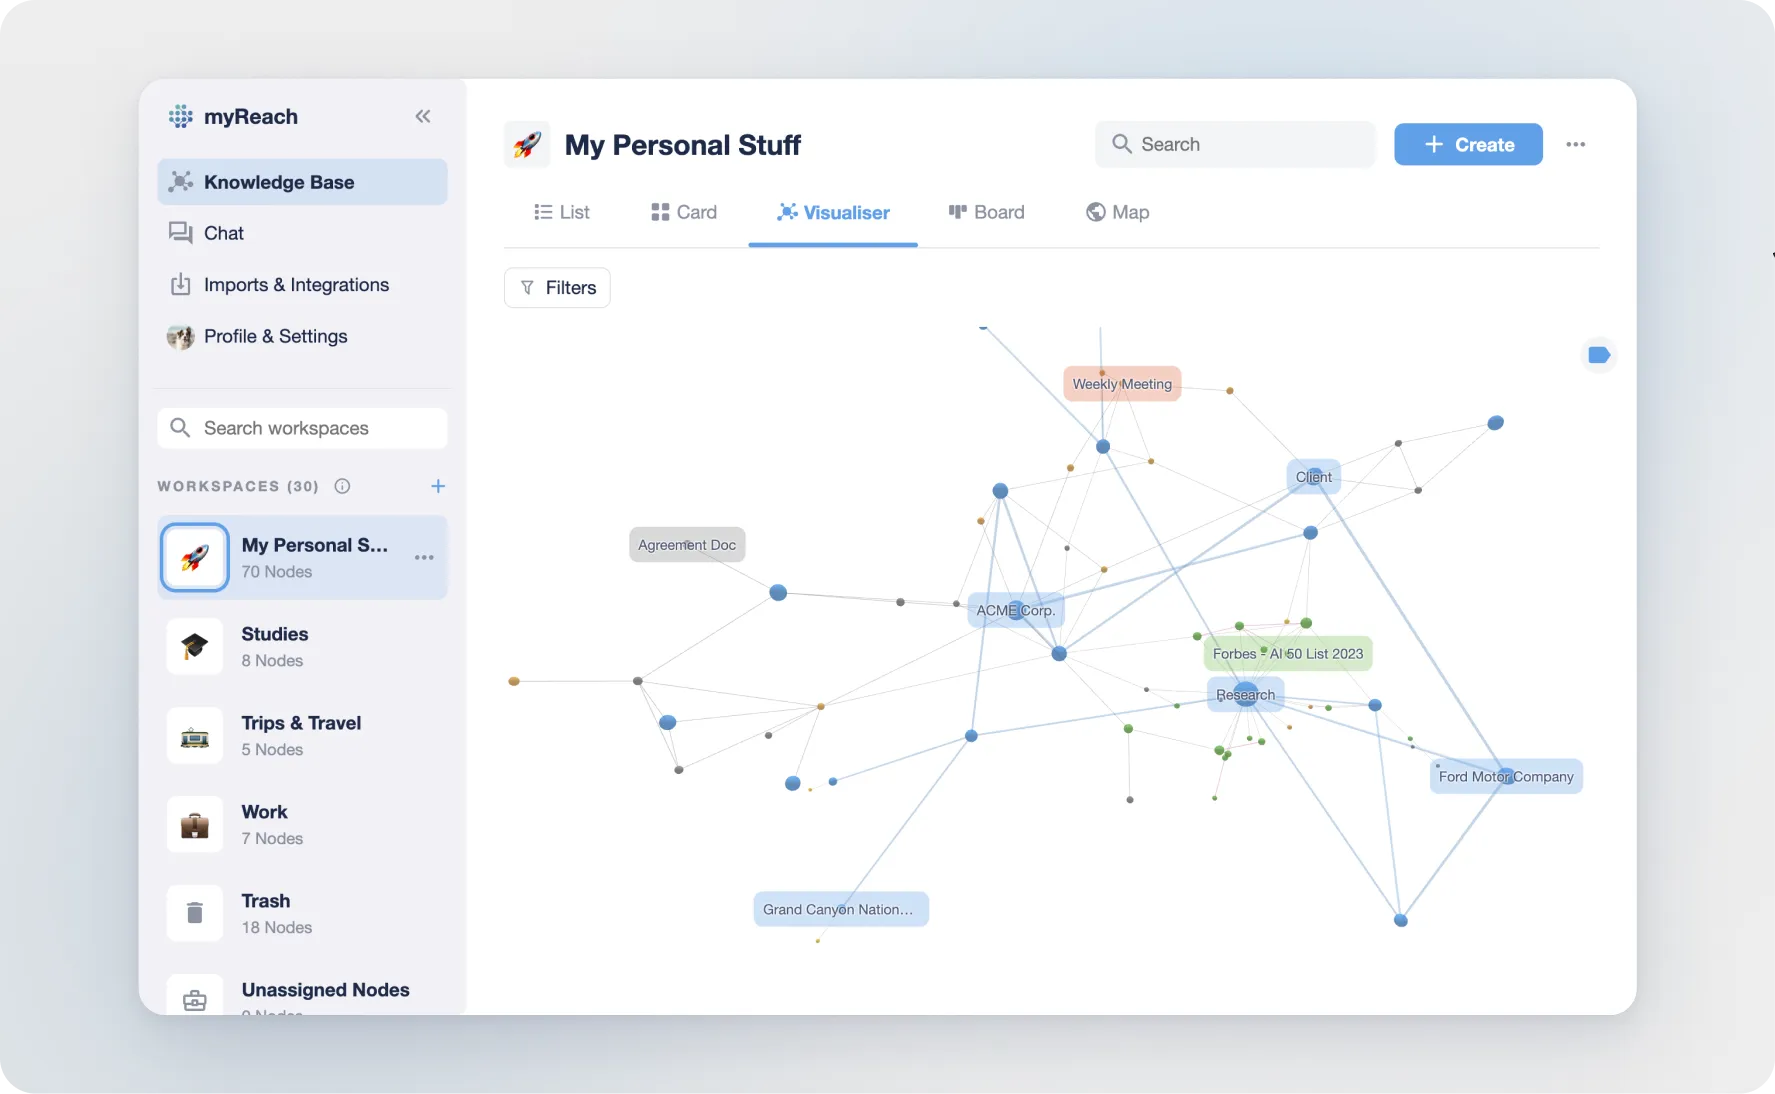
Understanding the Colours
The Visualiser uses colour-coding to help you instantly identify the types of information in your network:
Node Colours (The Dots)
-
Blue: Tags
-
Green: Websites and Bookmarks
-
Orange: Notes
-
Grey: Files and Documents
To avoid clutter, you can click on the top right corner label icon to toggle labels on or off.
Relationship Colours (The Lines)
Relationships between items are visually represented and colour-coded based on the type of node:
-
Blue: Direct links between two Tags.
-
Grey: Direct links between other Nodes (e.g. a Note linked to a PDF).
-
Red/Purple: Mentions-based relationships (automatically detected by the AI).
Key Functionalities
Contextual Filtering
Click on any Node to "focus" the view. The Visualiser will dim everything else and only show the Nodes directly connected to your selection. This is the best way to explore a specific project without being overwhelmed by the rest of your Knowledge Base.
To reset: Double-click anywhere in the empty 3D space.
Label Toggling
To keep the view clean when looking at thousands of Nodes, labels are hidden by default for smaller dots. You can toggle all labels on or off using the label icon in the top right corner.
Real-Time Discovery
As you accept AI Recommendations, you will see new lines appear in real-time, literally watching your digital brain grow more "intelligent" and interconnected.
Best Use Cases
-
Mind Mapping: Visualise a new project by connecting related research, contacts and notes in 3D space.
-
Identifying Gaps: Look for "lonely" Nodes that aren't connected to anything this usually means they need more tags or relationships to be easily found by the Assistant.
-
Knowledge Audits: See which Topics (Blue Nodes) have the most connections; these are your "Expertise Hubs".